
Metrics as a strategic lever: bridging the gap between engineering and the board
A three-tier framework for connecting technical performance to board-level profit
Engineering leaders often track multiple metrics, but few really resonate with the board. It is common to hear other functions complain that engineering is a black box where investment has no visible return. Engineering leaders must change this narrative for the organisation’s future.
Engineering metrics are not for monitoring engineers, they are levers for business growth. To bridge the gap between technical effort and business value, we must focus on signals like order conversion, infrastructure cost per order, and customer sentiment. Linking these metrics to specific initiatives transforms engineering from an opaque cost centre into an investment centre with a clear return on investment.
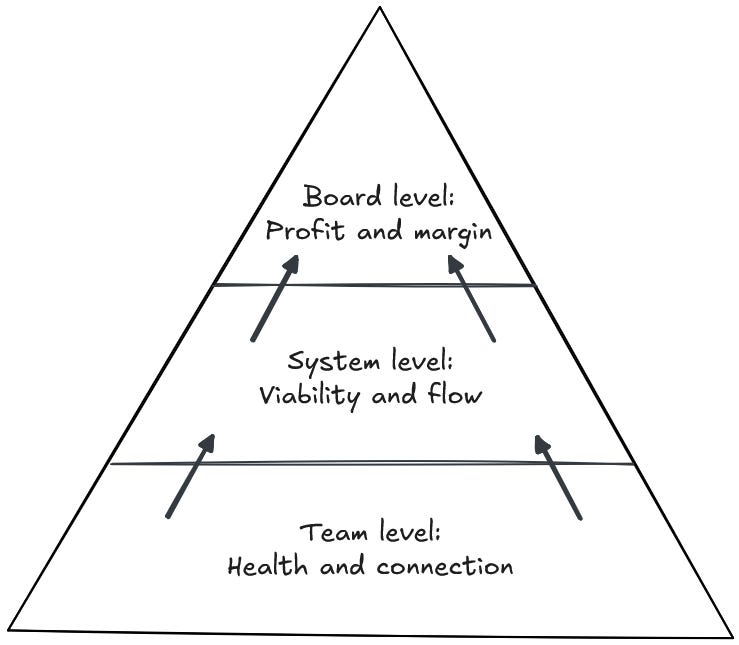
I categorise these signals into three tiers:
Board level: unit economics (e.g. infrastructure cost per order), order conversion, and customer feedback
System level: technical viability, risk, and delivery flow
Team level: organisational health, including retention and engagement
Focusing on the trend of these metrics, rather than isolated snapshots, allows leaders at every level to maintain a clear direction towards delivering value. While this mental model focuses on engineering, the CTO and CPO must share these metrics. This bridge requires a shared data language to operate as a single front. Alignment does not happen naturally, it requires an explicit agreement that unit economics are as important as feature delivery.
The board level signal: unit economics
Negotiating with a CFO requires moving beyond baseline expectations like uptime. While critical, uptime is a prerequisite, not a strategic lever. In contrast, discussing unit economics, such as cost per order or cost per licence, is a strategic conversation that aligns engineering investment with business profitability.
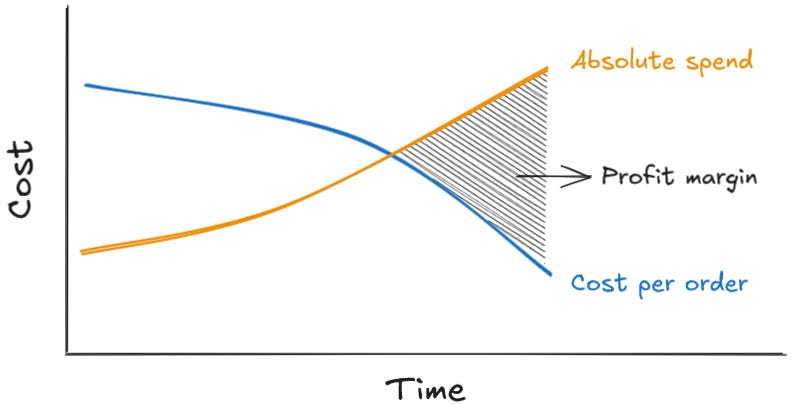
Justifying a roadmap pause to fix tech debt is a difficult sell to a board. However, framing that same effort as a way to drive efficiency by reducing the cost per order or accelerating the delivery of features driving extra revenue changes the calculation. This approach transforms a technical burden into a gross margin improvement.
These metrics are critical during budget season. Data-driven budgeting shifts the focus from departmental spend to return on investment. If the trend for cost per order is decreasing, an increase in absolute spending becomes a signal of healthy scaling rather than uncontrolled cost.
The system level signal: risk, complexity, and flow
While board metrics track financial performance, system metrics measure the viability of the technical choices. Standard frameworks like DORA or SPACE focus on efficiency and productivity. They inform how fast the organisation is moving, but they rarely signal if you’re moving in a dangerous direction. To avoid this, leaders must monitor signals that reveal accidental complexity, where architecture or tooling choices become bottlenecks rather than enablers.
For example, a project designed around an event store may look like the best technical solution initially. However, as work progresses, the choice of architecture may add a level of complexity that makes the project unviable. This risk can be identified by tracking specific system level trends: pending work growing faster than completion rate, and an increasing list of trade-offs required to deliver each phase.
When introducing new technology, I use a walking skeleton to bring risks forward, surfacing architectural bottlenecks before the cost of reversing becomes too high. The most critical red flag is if an ETA remains unchanged or is pushed back while scope or complexity increases. At this point, you must intervene to reallocate capacity or narrow the scope, rather than hoping the team will catch up.
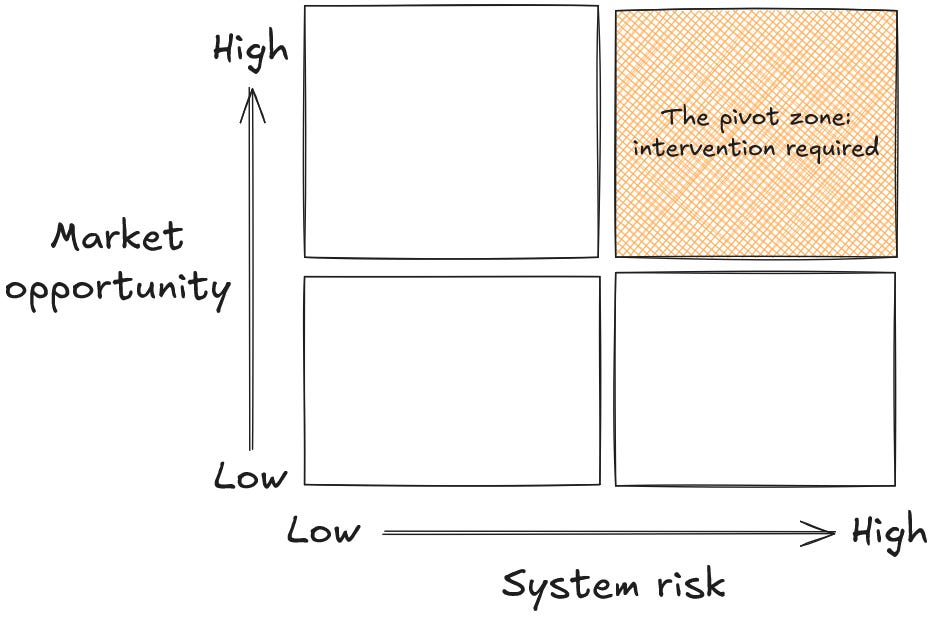
The pivot: metrics as a decision trigger
There are moments when board and system signals collide. If an initiative has an expanding ETA (system signal) while the organisation faces a market share risk due to a missing strategic capability (board signal), the current path is no longer viable. At this point, leadership must intervene to stop the sunk cost fallacy.
We terminated our event store project because the system signal (expanding timelines) clashed with a board level threat (loss of market share). It was a hard trade-off: we sacrificed long-term efficiency to protect immediate revenue growth. While data helps justify the pivot to the board, it rarely solves the impact to morale. I had to manage the direct risk of losing senior engineers who saw the project as a career driver. We mitigated this by linking their skills to the new strategy, although we also accepted the risk that some engineers might leave for more technical challenges.
Framing this decision is key. This deliberate pivot signals investment logic rather than team failure. When communicating this to the teams, data is the most effective tool for maintaining morale. By showing that the project was cancelled due to a changing business case rather than poor engineering performance, you decouple individual professional value from project outcomes. This clarity allows engineers to transition to new priorities with their focus on the lessons learnt rather than the pain of a cancelled roadmap.
The team level signal: connecting code to value
Teams often view metrics as a top-down monitoring tool that prevents them from focusing on delivering business value. To avoid this, leaders must use metrics to provide autonomy. If a team can reduce the cost per order while maintaining quality, metrics like tickets completed become irrelevant. Then the team moves from shipping code to delivering value.
In our all-hands, I own the narrative by explicitly linking technical milestones back to strategic outcomes. We work with each lead to set quarterly objectives that map directly to these board level signals. This helps every person to understand how a single pull request impacts a board level metric like cost per order.
Beyond economics, I monitor team engagement and retention as leading indicators of delivery stability. These human signals often flag that delivery stability is at risk before the financial metrics begin to drop. By tracking these trends, I can intervene in organisational health before the system begins to fail.
Conclusion
Remember: using the right metrics is about giving teams autonomy by providing context through transparency, allowing them to make trade-off calls independently. As an engineering leader you must provide the right data for the team to reach the desired destination. This helps create a culture where every engineer understands the impact of their work on the company’s results. When an engineer sees the cost per order trend, they aren’t just writing code, they are managing the company’s gross margin.
When engineering metrics meet business signals, you are no longer simply reporting status. You are using these metrics as levers for growth to help plan the company’s budget, transforming technical performance into strategic profit.